Compare DE genes across methods
In this section we will compare the DE gene lists obtained from different DE methods (e.g. Ballgown, EdgeR, DESeq2)
Visualize overlap with a venn diagram. This can be done with simple web tools like:
Once you have run the DESeq2 tutorial, compare the sigDE genes to those saved earlier from ballgown and/or edgeR:
head $RNA_HOME/de/ballgown/ref_only/DE_sig_genes_ballgown.tsv
head $RNA_HOME/de/htseq_counts/edgeR/DE_sig_genes_edgeR.tsv
head $RNA_HOME/de/htseq_counts/deseq2/DE_sig_genes_DESeq2.tsv
Pull out the gene IDs
cd $RNA_HOME/de/

cut -f 1 $RNA_HOME/de/ballgown/ref_only/DE_sig_genes_ballgown.tsv | sort | uniq > ballgown_DE_gene_symbols.txt
cut -f 2 $RNA_HOME/de/htseq_counts/edgeR/DE_sig_genes_edgeR.tsv | sort | uniq | grep -v Gene_Name > htseq_counts_edgeR_DE_gene_symbols.txt
cut -f 7 $RNA_HOME/de/htseq_counts/deseq2/DE_sig_genes_DESeq2.tsv | sort | uniq | grep -v Symbol > htseq_counts_DESeq2_DE_gene_symbols.txt
To get the gene lists you could use cat to print out each list in your terminal and then copy/paste.
cat ballgown_DE_gene_symbols.txt
cat htseq_counts_edgeR_DE_gene_symbols.txt
cat htseq_counts_DESeq2_DE_gene_symbols.txt
Alternatively you could view the lists in a web browser as you have done with other files. These files should be here:
- http://YOUR_PUBLIC_IPv4_ADDRESS/rnaseq/de/ballgown_DE_gene_symbols.txt
- http://YOUR_PUBLIC_IPv4_ADDRESS/rnaseq/de/htseq_counts_edgeR_DE_gene_symbols.txt
- http://YOUR_PUBLIC_IPv4_ADDRESS/rnaseq/de/htseq_counts_DESeq2_DE_gene_symbols.txt
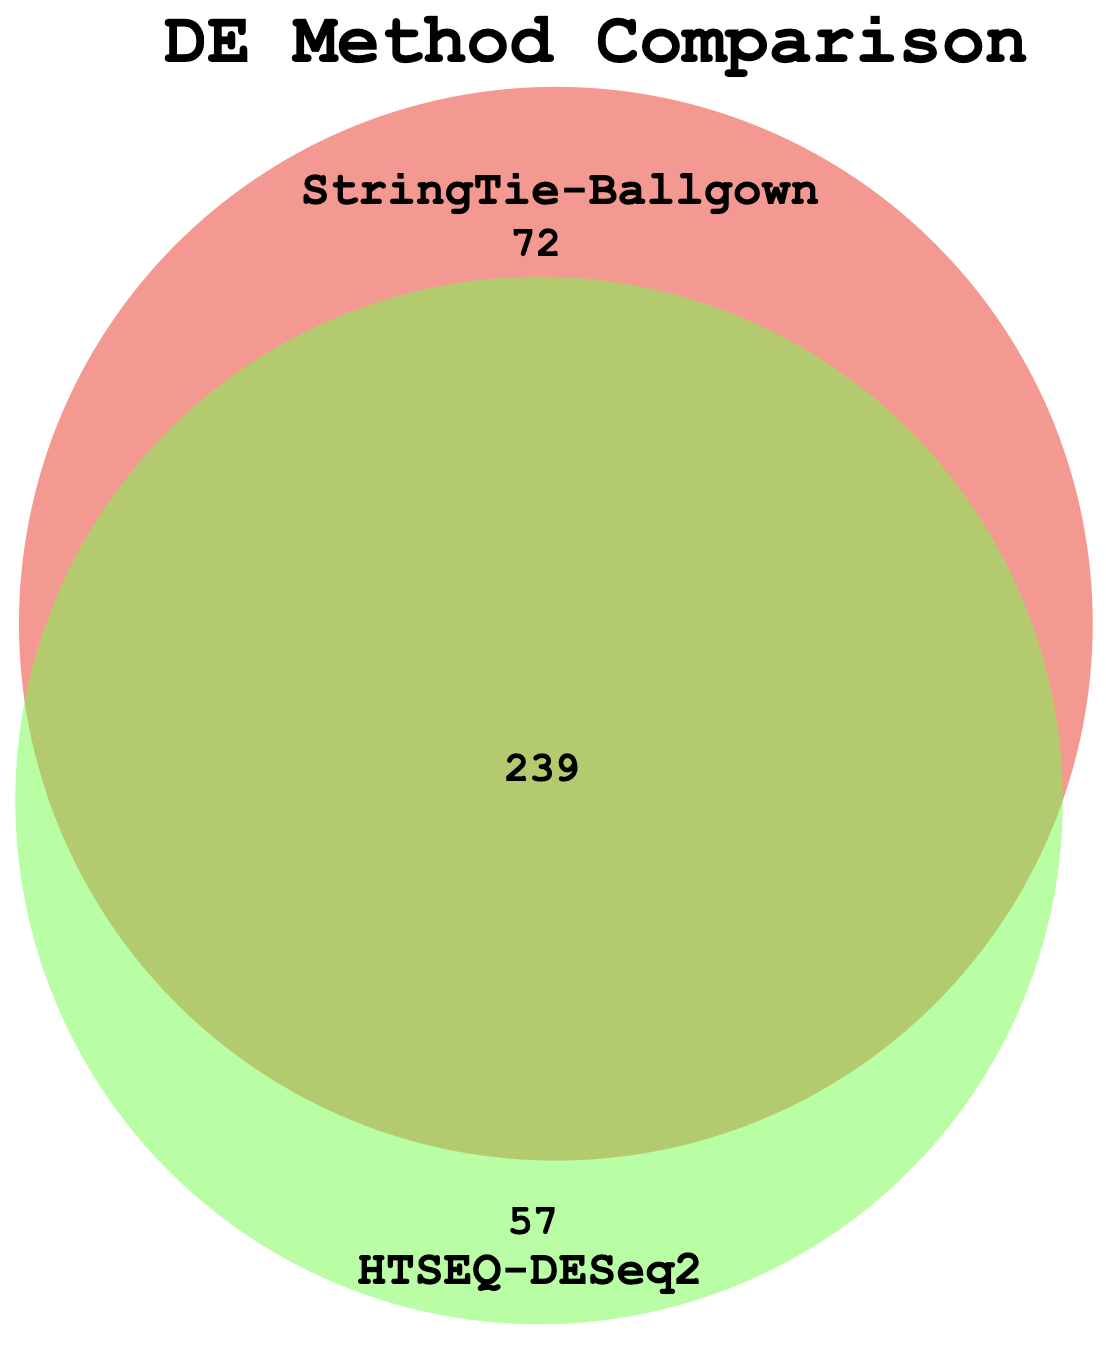
Example Venn Diagram (Two-way comparison: DE genes from StringTie/Ballgown vs HTSeq/DESeq2)
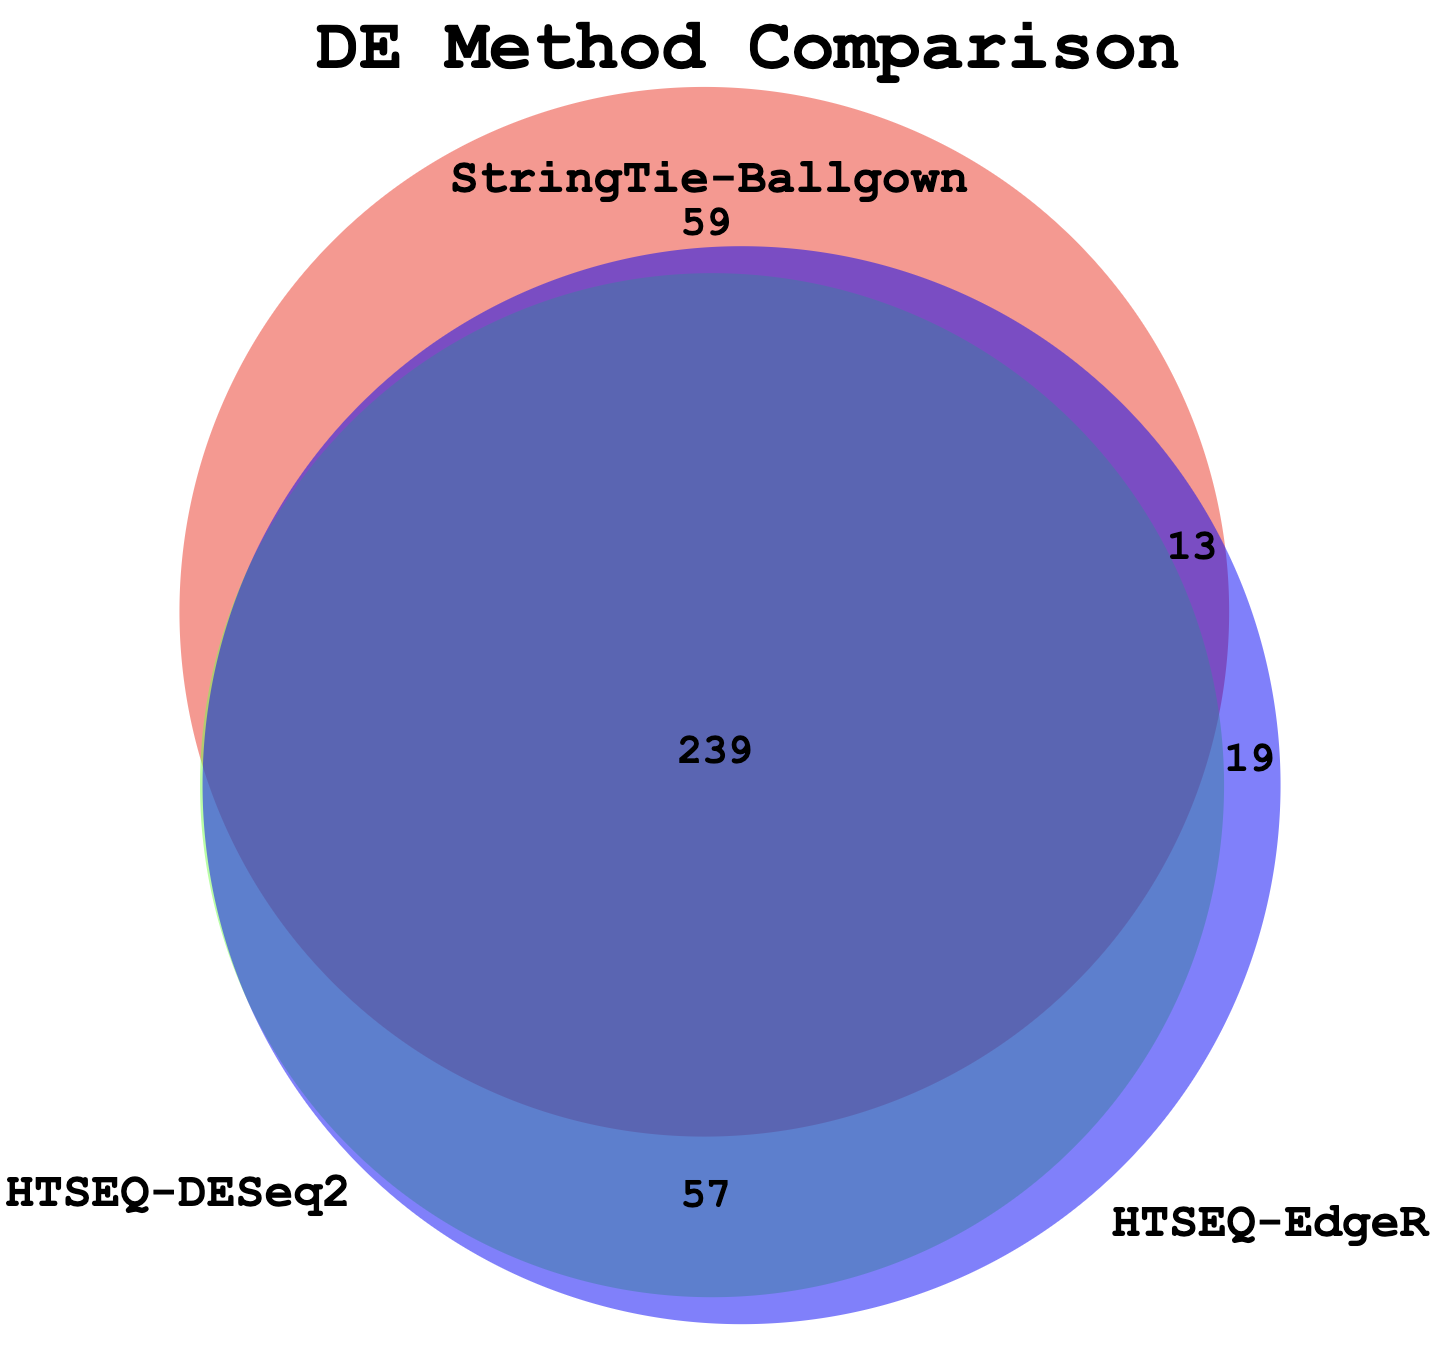
Example Venn Diagram (Three-way comparison: DE genes from StringTie/Ballgown vs HTSeq/DESeq2 vs HTSeq/EdgeR)