scRNA-seq Data
Obtain single cell RNA-seq test data.
The data that will be used to demonstrate scRNA analysis in this module has been published: Freshour et al. 2023. If you use this data in your own benchmarking, tool development, or research please cite this article. The complete raw sequence dataset can be obtained from SRA at accession: PRJNA934380.

Model system
The full details can be found in the publication but briefly these data are generated from a murine bladder cancer model system with the following characteristics:
- Mice were exposed to a carcinogen 4-hydroxybutyl(butyl)nitrosamine (BBN) via drinking water
- Tumors developed and were isolated to create cell lines. One of these lines known as “MCB6C” was the source of the scRNA data used here.
- MCB6C cells were used to create tumors in mice that could be studied for response to immunotherapies.
- The mice used for these experiments are Black 6 (B6NTac) male mice.
Experimental details
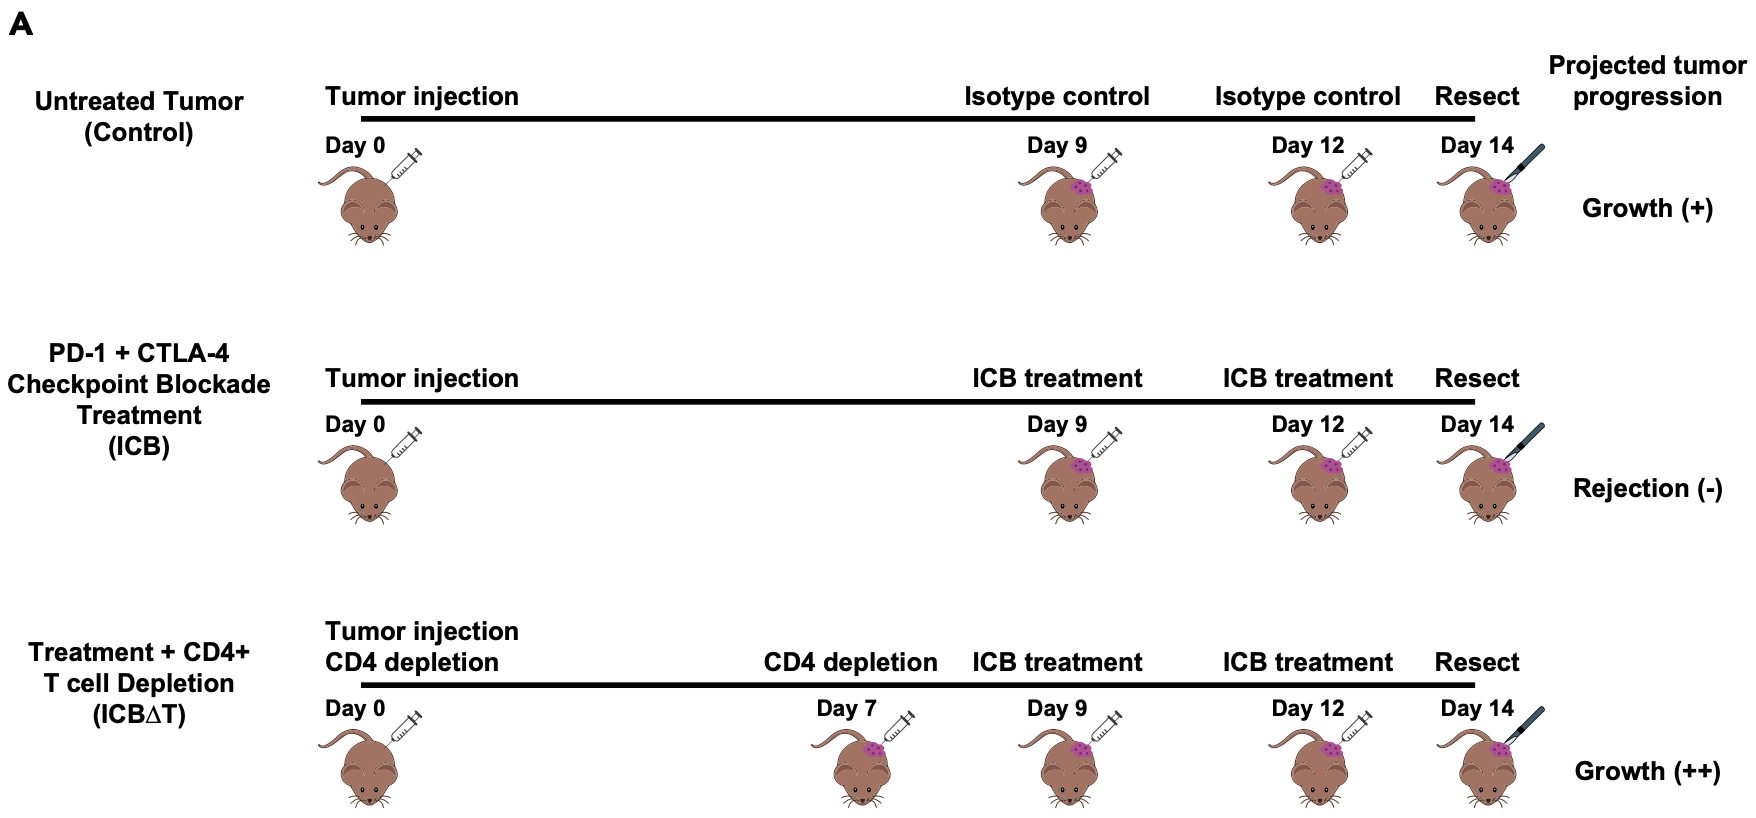
Briefly, the experimental details are depicted below and summarized briefly here.
- Each biological sample consists of bulk tumor samples obtained from three MCB6C tumors that were resected and pooled.
- Mice with MCB6C tumors were subjected to one of three conditions: control, treatment with immune checkpoint blockade (“ICB”), and treatment with ICB after depletion of CD4 cells in the mice (“ICB-dT”).
- The ICB treatment consists of combined PD-1/CTLA-4 immune checkpoint blockade treatment.
- The timing of tumor injection, CD4 depletion, ICB treatment and tumor resection are depicted below.
- The tumors grow aggressively without treatment, are rejected with ICB treatment, but grow even more agressively if CD4 cells are depleted (even in the presence of ICB treatment).

Data generation
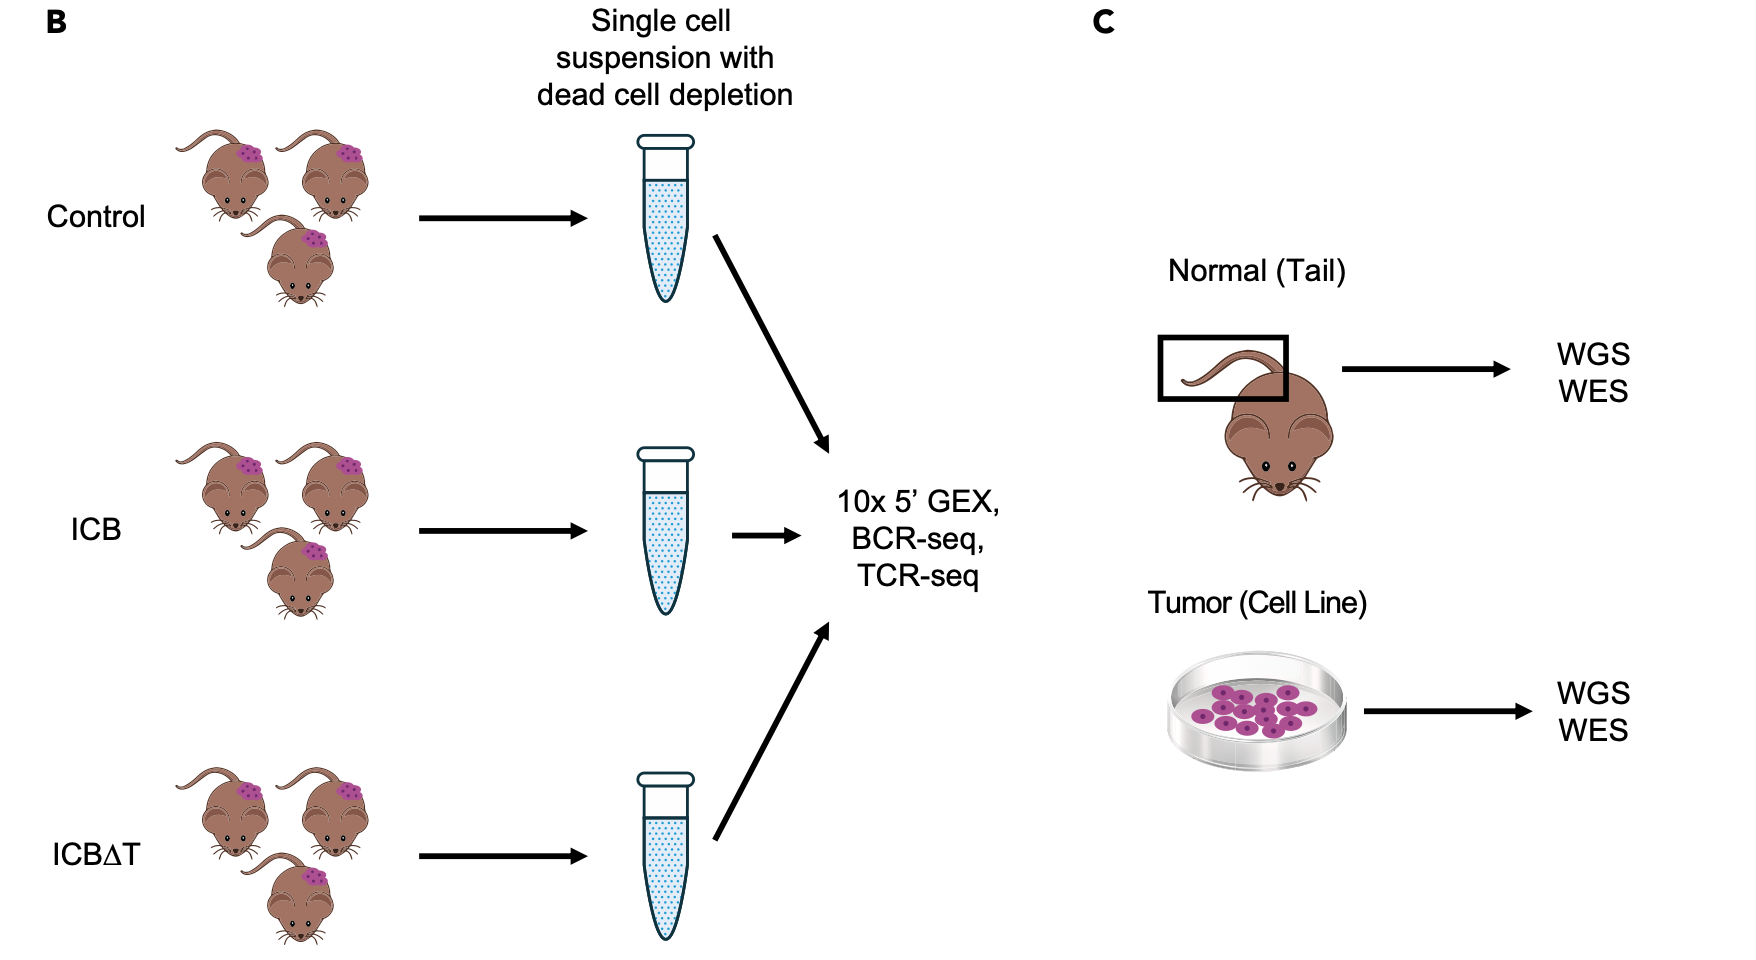
The method and types of data generation are depicted below and summarized briefly here.
- From pooled MCB6C tumors, single cell suspensions were obtained and subjected to dead cell removal, but no other sorting or filtering.
- A target of 10,000 cells was submitted for 10x library creation using the 5’ (v2) Kit.
- The same libraries were subjected to 10x Genomics V(D)J B cell receptor (BCR) and T cell receptor (TCR) enrichment and sequencing.
- A total of 8.3 billion sequence reads were generated and 64,049 single cells identified. A subset of these will be analyzed here.
- In addition to the scRNA data, bulk DNA of the MCB6C system was also subjected to exome and whole genome sequencing. These data were compared to paired data from bulk genomic DNA obtained from the tail of the mouse originally used to establish the MCB6C line.
- Bulk RNA-seq data were also generated for MCB6C tumors and a culture of the MCB6C line.

Description of samples/replicates and QC reports
In the following demonstration analyses we will focus on a simplified comparison of two biological conditions: treatment with checkpoint (“ICB”) or treatment with ICB after depletion of CD4 cells in the mice (“ICB-dT”). For each of these two conditions we will have three replicates (of five total reported in the publication).
List of replicates with labels and links to multi QC reports (these data were processed with Cell Ranger v7.0.0):
- Rep1_ICB: 4,179 cells, 1,759 median genes per cell
- Rep3_ICB: 6,486 cells, 1,645 median genes per cell
- Rep5_ICB: 3,006 cells, 1,163 median genes per cell
- Rep1_ICBdT: 4,024 cells, 2,096 median genes per cell
- Rep3_ICBdT: 5,665 cells, 1,735 median genes per cell
- Rep5_ICBdT: 6,074 cells, 1,336 median genes per cell
QC report discussion
Using the report for Rep1_ICB as an example, explore and discuss the following points:
-
Alerts. We have one alert in this example and it is an expected consequence of how we ran Cell Ranger. Other alerts can indicate a variety of problems…
- On the Cells tab. Note the number of cells identified (4,179), median reads per cell (96,808), median genes per cell (1,759), and confidently mapped reads in cells (94.82%).
- Take a look at the t-SNE projection. This will be your first crude glance at the heterogeneity of the cell population. Are distinct clusters forming, or just one big blob? How does that align with your biological expectation?
- We could start to look at the genes expressed in each cluster, but we’ll get into this a lot more deeply in Loupe and especially Seurat.
-
Switch to the VDJ-T and VDJ-B tabs. Note the number of cells and number with a productive V-J pair. How does this compare to your expectation for the presence of T and B cells? Is there any evidence for dominant clonotypes?
- Switch to the Library tab and back to Gene Expression. Note the total number of reads (593,884,498).
-
What proportion of reads were confidently mapped to the Genome (88.81%), Transcriptome (76.50%), and Exonic regions (74.60%)?
- Look at the GEX Barcode Rank Plot. Is there a relatively sharp inflection point where drops are considered to be “Cells” compared to those considered “Background”?
- In this case, we have 4,179 droplets being called “Cells”. Note how this lines up on the x-axis (“Barcodes” == “Cells”).
-
These cells have between ~500 and ~100,000 UMIs (unique fragments sequenced). Any droplet below ~500 UMIs is not being considered a cell according to Cell Ranger and is instead being considered “Background”. In other words, indistinguishable from the free floating molecules that would wind up in droplet by chance (aka “ambient RNA” or “soup”) even if there was no cell there.
- Now look at the Sequencing Saturation plot and metric (93.21%).
- Does it appear that we have exhausted or are close to exhausting the new information in the library? Would it make sense to continue sequencing this same library deeper?
Input files for the demonstration analysis
We will not be running Cell Ranger ourselves and will instead be starting the scRNA analysis in R using matrix files from Cell Ranger (cellrange multi to be precise) and a few other input files briefly described here:
- Various publicly available reference annotation files (e.g. reference cell type signatures, chromosome coordinates, pathway gene sets, etc.).
- Filtered Feature Barcount Matrix files (.h5) from Cell Ranger. 6 total, one for each sample listed above.
- V(d)J clonotype files for TCR and BCR.
- Somatic variants (SNVs/Indels) identified by analysis of the bulk tumor/normal exome data for MCB6C.
- Somatic copy number variants (CNVs) identified by analysis of the bulk tumor/normal WGS data for MCB6C.
Loupe Browser demonstration for preliminary exploration of the MCB6C data
Briefly explore the MCB6C data using the 10X Loupe browser. Use the following two samples as examples:
Input data files
| Sample | GEX Cloupe | TCR Vloupe | BCR Vloupe |
|---|---|---|---|
| REP3_ICB: | Rep3_ICB GEX cloupe | Rep3_ICB TCR vloupe | Rep3_ICB BCR vloupe |
| REP3_ICBdT: | Rep3_ICBdT GEX cloupe | Rep3_ICBdT TCR vloupe | Rep3_ICBdT BCR vloupe |
Exercise
Work through a very basic intro to the Loupe browser with the following steps:
- Open the Loupe browser and load the single cell gene expression data (
Open Loupe File) for the Rep3_ICB sample. - Load the corresponding BCR and TCR single cell clonotype data (
V(D)J Clonotypes->Upload a .vloupe file). - Use the
Featuressection to view cells with Epcam (epithelial marker) expression. Apply a filter and require a minimim cutoff of1. - Use the
Featuressection to view cells with Cd3d expression. How does this compare with cells that have a TCR V(D)J sequence? - Use the
Featuressection to view cells with Cd19 expression. How does this compare with cells that have a BCR V(D)J sequence? - Use the
Featuressection to create a feature list:EpithelialwithEpcamandPsca. - Use the
Featuressection to create a feature list:T cellwithCd3d,Cd3e,Cd3g,Cd4, andCd8a. - Use the
Featuressection to create a feature list:B cellwithCd19,Pax5,Cd79a, andCd79b. - Use the
Featuressection to create a feature list:OtherwithIFng,GzmaandEomes. Based on the markers these cells do and do not have, what are these cells likely to be? - What cluster # corresponds to the “Other” cells (cluster 13). Highlight that cluster in the Clusters view.
- View the p-value sorted list for cluster 13.
- Select the
Klra4feature and view the Expression Distribution view. - Select all clusters and view the Heat Map view. What is notable about many of the most Up-regulated genes in this view?
- Return to the V(D)J Clonotypes view. Select the 40 clonotypes with a count of 3 or greater. Observe the pattern of this subset of T cells in the t-SNE. Hit the “Save Barcodes” button. This will create a custom set in the Clusters view. In this view you can perform a Differential Expression analysis, comparing these expanded CDR clonotype cells to all other cells. What are the top genes? (Gzmk, Pdcd1, Cxcr6, Lag3, Gzmb, etc.)
Loupe V(D)J Browser demonstration for preliminary exploration of the MCB6C data
Briefly explore the MCB6C data using the 10X Loupe V(D)J browser.
Exercise
Work through an intro to the Loupe V(D)J browser with the following steps:
- Open the Loupe V(D)J Browser and load the TCR expression data (
Open Loupe V(D)J File) for the Rep3_ICB sample. - Look at the Clonotype Distribution plot. At a high level, is this a highly diverse TCR repertoire? Is there evidence of clonal expansion?
- Select the
Summary Plotstab. Look at the Clonotype Abundance plot. Explore V(D)J gene segment usage with the individual Gene Usage plots and the V-J Gene Heatmap. - Go back to the Clonotype Distribution and Sequence tab. Select a clonotype from the Clonotype Distribution plot (or the list on left) to learn more about its alpha and/or beta receptors.
- What are the main components of the receptor(s)? Zoom into the base-level view of a CDR3 region. How many barcodes, UMIs and reads support the clonotype? What is the difference between Universal Reference, Donor Reference, and Consensus sequence? Are there any sequence differences between the consensus and references? What do these likely represent?
- Go back to the Clonotype Distribution view and use
Open Filterto create a filter. Limit to only clonotypes with 10 or more barcodes. - Use
ExporttoExport barcodes in clonotype listand save to your computer (choose a filename and place that you can find later, e.g., Rep3_ICB-Expanded.csv). - If you still have your Loupe browser session open from the exercise above, go there and select the
Clustersview, next to+ Create a new groupselect the Upload arrow button, select the csv file you saved from the Loupe V(D)J browser. Where are these T cells? Are they localized to a specific cluster? What features characterize that cluster? - Try additional filtering strategies to identify subsets of T (or B) cells of interest in the Loupe V(D)J browser, export, and then visualize them in the Loupe Browser on the TSNE/UMAP view.
